ABI News | San Diego MSA 2Q Review: Construction Shortage to Intensify by 2020
San Diego MSA: Construction Shortage to Intensify by 2020
By: Thomas M. Brophy, Director of Research
The analysis that follows is meant to provide a very top level view of apartment market demand and makes no assertions as to quality/type of build, simply focuses on the actual units that are/will be needed/delivered. In order to streamline the analysis process the following assumptions were made: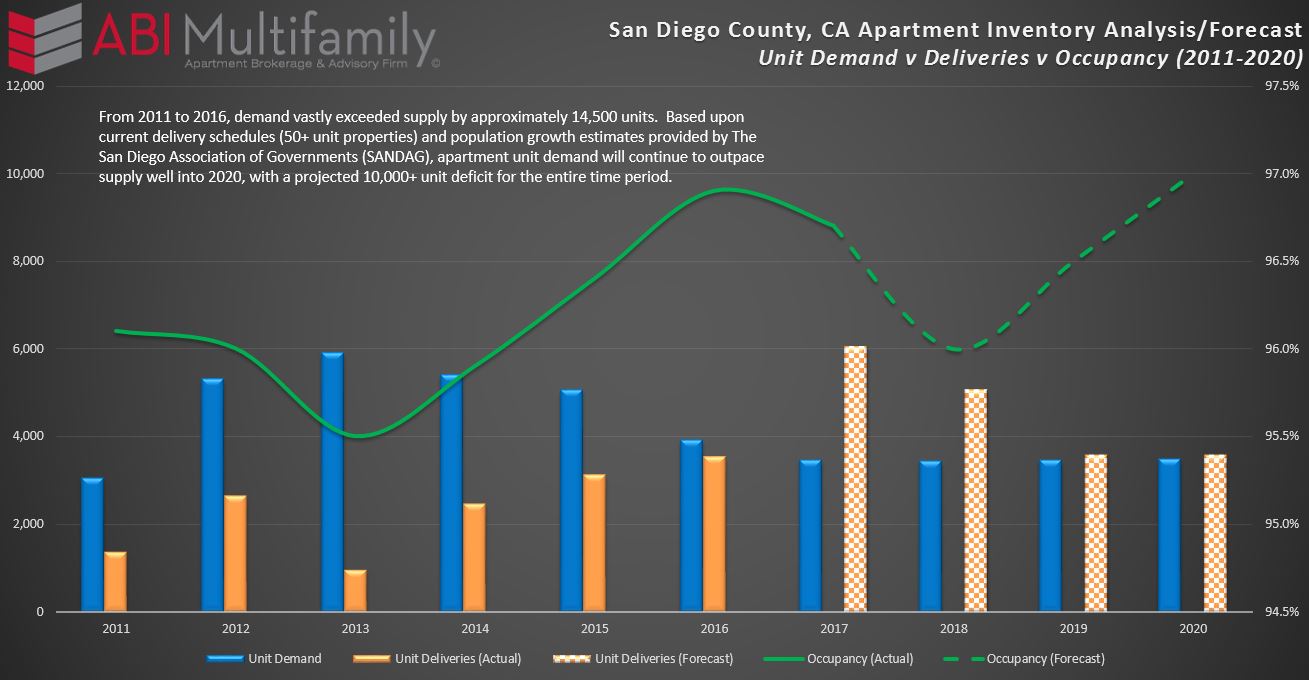
Unit Demand = (((Population1 - Population2) / Average HH Size) * Renter HH %) * Occupancy Rate
(1) Population Data comes from San Diego Association of Governments population estimates/projections (2011-2020) and based only on Population Growth of the 20 to 74 year old demographic segment
(2) Average Household (HH) Size is based off Census estimates and internal ABI projections as follows: 2010/11=2.73, 2012=2.77, 2013=2.80, 2014=2.83, 2015=2.85, 2016=2.88, 2017-2020=2.90 (est)
(3) Renter Household (HH) Percentage is based off Census estimates with internal ABI projections as follows: 2011=44.8%, 2012=45.5%, 2013=46.2%, 2014=46.6%, 2015=47.1%, 2016=47.5% (est), 2017=47.9% (est), 2018=48.3% (est), 2019=48.7% (est) and 2020=49.1% (est).
(4) Units Deliveries for 2017/18 are based on projects currently Under Construction as of 2Q 2017 (9,675 units, 50+ unit properties) with delivery expected by end of 2018. For 2019/20, projects currently Under Construction with deliveries set through 2020 + assuming that 100% of all Planned units as of 2Q 2017 (6,347) will be completed by 2020 as well.
(5) Occupancy Rate is based off actuals (source Yardi) and internal ABI projections as follows: 2011=96.1%, 2012=96.0%, 2013=95.5%, 2014=95.9%, 2015=96.4%, 2016=96.9%, 2017=96.7% (est), 2018=96.0% (est), 2019=96.5% (est), 2020=97.0% (est)
From 2011 to 2016, demand vastly exceeded supply by approximately 14,500 units. Based upon current delivery schedules (50+ unit properties) and population growth estimates provided by The San Diego Association of Governments (SANDAG), apartment unit demand will continue to outpace supply well into 2020, with a projected 10,000+ unit deficit for the entire time period. As a result by 2020, the Occupancy Rate for the San Diego MSA, barring any unexpected increases in current construction levels, is forecasted to reach an all-time high of approximately 97%.
San Diego Market Metrics: By the Numbers
The MSA's total sales volume (5+ unit properties) increased 21%, year-over-year, to $1.01 billion across 118 transactions representing 3,976 total units sold. Sales of 50+ unit properties witnessed the greatest sales volume increase rising 33% y-o-y to $749.9M. Average price-per-unit amount increased as well to $279,393 or 9%. Whereas 50+ unit properties saw sales volume increase, 5 to 49 unit properties saw its volume decrease (4%) to $260.5M with a moderate 3% increase in average price-per-unit amounts to $201,620.
The San Diego MSA experienced a (44%) y-o-y decrease in 2Q 2017 unit deliveries with 430 new units delivered to the market. Nonetheless, San Diego area developers are on track to deliver 6,000+ new units by YE 2017. Despite elevated unit deliveries, occupancy rates for the MSA contracted slightly, (0.3%), to 96.8% while average rent increased 4.4% to $1,798. East County Submarket claimed the top spot in the MSA for rent growth at 6.7%, followed by South Bay at 5.5%, North County Inland at 4.9%, Metro San Diego at 3.8% and North County Coastal at 3.7%. Although North County Coastal saw the lowest average rental rate percentage increase for the MSA, it still claims the top spot in actual average rent which at $1,837 is the highest in the region.
In regards to occupancy, South Bay Submarket was #1 at 97.5%, North County Coastal came in #2 at 97.1%, East County was #3 with 97.0%, North County Inland #4 at 96.8% and Metro San Diego #5 at 96.5%. Both North County Coastal and South Bay were the only submarkets to see occupancy rate increases at 0.2% and 0.1% respectively whereas the other submarkets all experienced minor contractions averaging (0.5%).
Outlook
I firmly stick behind my 2017 Market Forecast, despite Fed chatter and three 25-50bps increases behind us, it is unlikely the Fed will continue with its gradual interest rate increase for the balance of 2017 despite many economists predicting otherwise. Basis for this sentiment is rooted in two primary areas, namely weak inflationary pressures, as stated by Yellen, and continued sub-3% GDP growth post-recession. This isn't to say that we are without headwinds; in fact, given government stasis in key legislative areas, specifically healthcare and tax reform, has resulted in loss of the ‘Trump bounce' yet people remain largely optimistic. Additionally, despite the projected end to gradual interest rate increases, the Fed has made statements it wants to move towards ‘balance sheet reduction' or QT, quantitative tightening, which certainly has the potential to sap liquidity from the market. Internationally there is still significant instability in both EM (Emerging) and DM (Developed) markets, particularly across Europe and Asia. It's helpful to remember some 50%+ of the world's developed markets continue to operate at zero or below interest rates which has led to capital flight. Despite stocks hitting all-time highs, based in large part on investors factoring in massive deregulation, markets the world over have been prone to ever increasing volatility fits.
The San Diego MSA has, on the whole, shown amazing resiliency in both up-and-down markets. Basis for this resiliency is most often correlated to perfect climate and people seeking it out. To wit I must agree but I also believe, with tangential data to support my hypothesis, that much of San Diego's success lies in the insularity of the investors who buy in the market, e.g. in 2Q approximately 70% of all unit transactions can be traced to San Diego area buyers. Although there are several opportunistic/value-add players in the market, most owners/investors can be classified as ‘long term, net holds;' in effect creating its own barrier to entry in addition to price point. Given the headwinds discussed in the paragraph above and lack of new supply will continue to fuel investor demand for San Diego multifamily.
To be followed with a more expansive ABInsight post on the topic, I want to leave you with a few thoughts, questions I have posited to various economists, business executives and investors: has the Federal Reserve's, along with the other central banks, massive balance sheet run-up (QE) and zero-to-negative interest rate policy created a banker's worst nightmare, i.e. deflation? By way of example, in our current cycle massive amounts of money have been piled into the development of artificial intelligence, production automation (think automated car production, 3D printed homes, robot burger flippers etc) and other technological disruptions, the effects of which are only beginning to feel and/or understand. As a result, and my final question, are we on the precipice of a massive reduction in the cost-of-goods? If yes, cui bono?
Click here to view the full San Diego MSA Multifamily 2Q 2017 Report
Click here to listen to our San Diego MSA 2Q 2017 'Multifamily Minute' Podcast